The following sections outline the available data for various indicators of the status of women in the state of Wisconsin. The quality of included resources has been deemed satisfactory by the agencies and organizations that have published the reports.
The resources in this bibliography are intended to provide a reference for future research on the local status of women, compiling datasets and data sources previously used to report on the status of women in Northeast Wisconsin.
BENEFIT ENROLLMENT PROGRAM
The U.S. Census Bureau American Community Survey (ACS) provides 1-year and 5-year estimates for Food Stamps/SNAP enrollment for household type, with/without children, poverty status, disability status, race, median household income, and work status.
Find updated poverty guidelines for the 48 contiguous states and the District of Columbia here:
- U.S. Department of Health & Human Services, ASPE, Poverty Guidelines for 2022, Poverty Guidelines for the 48 Contiguous States and the District of Columbia
From the Wisconsin Department of Children & Families website: “The Division of Early Care and Education Annual Report: Early Care and Education in Wisconsin summarizes data related to children and families supported by programs in the Wisconsin Department of Children and Families’ Division of Early Care and Education (DECE). This report highlights information about regulated child care programs serving Wisconsin families and the activities throughout the Division that support program quality improvement, fraud reduction, and improved access to affordable high-quality child care.” We can use these reports to access tables about which children are served by age, race, ethnicity, copayment type. We can also find information about different program offerings.
From the DPI website: “These data reports give an overview of number of sites, participation, revenue, expenditures, and reimbursements for the National School Lunch Program, School Breakfast Program, Afterschool Snack Program, Special Milk Program, Child and Adult Care Food Program, Summer Food Service Program, Donated Food Distribution Program, Elderly Nutrition Improvement Program, and Wisconsin School Day Milk program.”
CORPORATE LEADERSHIP
Milwaukee Women Inc. research documents the number of women on each public company board, selected regional, and national data, with insights from leading Wisconsin CEOs on how they achieved their best-in-class results.
EDUCATION ATTAINMENT
The following ACS tables outline the level of education completed for male and female U.S. adults over 25 years old. B15002 includes all races, whereas each table shows the same data for different races, including Black, American Indian or Alaska Native, Asian, non-Hispanic White, andHispanic or Latino.
U.S. Census Bureau, American Community Survey, B15002 and C15002B / C / D / H / I:Sex by Educational Attainment for the Population 25 years and over, 1-year and5-year estimates
This ACS table outlines the primary Bachelor’s degree major for men and women by age group.
U.S. Census Bureau, American Community Survey, B15011: Sex by Age by Field of Bachelor’s Degree for First Major for the Population 25 years and Over, with a Bachelor’s degree or higher attainment, 1-year and 5-year estimates
FREE AND REDUCED-PRICE SCHOOL MEALS
From the DPI website: “These data reports give an overview of number of sites, participation, revenue, expenditures, and reimbursements for the National School Lunch Program, School Breakfast Program, Afterschool Snack Program, Special Milk Program, Child and Adult Care Food Program, Summer Food Service Program, Donated Food Distribution Program, Elderly Nutrition Improvement Program, and Wisconsin School Day Milk program.”
From the DPI website: “These data reports provide information regarding student enrollment and free and reduced-price eligible students. The report also provides meal participation data by free/reduced price and paid categories. The source data for the annual E&PR comes from annual October reimbursement claims submitted to the DPI by Local Education Agencies (LEAs)…E&PR is typically posted near the beginning of the following year. Districts and private schools that are not listed do not participate in USDA Child Nutrition Programs.”
Under “Free and Reduced Meal Applications”, there is an updated Parent/Guardian information Letter/FAQ document which outlines eligible income levels for school lunch programs.
HEALTH AND WELL-BEING
Health data are the most complete and accurate because the data are sourced directly from vital records.
County Health Rankings & Roadmap data compiles various health outcome factors and can be used to obtain county data or to compare health rankings of counties. This data is formatted as interactive maps.
County Health Rankings & Roadmap, Robert Wood Johnson Foundation and University of Wisconsin Population Health Institute, Wisconsin County Health Rankings
Note: Data for this report is from various sources and uses 1-year and 5-year estimates between the years 2013 and 2020, depending on the health factor of interest.
Also note: Although the reliability of some Rankings’ measures is not ideal, when multiple measures are used to capture an underlying concept, the reliability improves. For example, each of the single measures used in morbidity may suffer from some reliability weaknesses, but taken together, their measurement of morbidity has shown great reliability.
County Health Rankings & Roadmap, Robert Wood Johnson Foundation and University of Wisconsin Population Health Institute, 2021 Wisconsin County Health Rankings, Suicides
The Wisconsin Interactive Statistics on Health (WISH) query system gives you information about health indicators (measures of health) in Wisconsin. WISH allows policy makers, health professionals, and the public to submit questions (requests for data) and receive answers (tables) over the Internet. To construct answers to your questions, WISH uses protected databases containing Wisconsin data from a variety of sources. Most modules contain data for multiple years and geographic areas.WISH houses a variety of different health factors including maternal and infant health, mortality, alcohol and drug use, and behavioral risk factor trends.
Wisconsin Dept. of Health Services, Division of Public Health, Office of Health Informatics, Wisconsin Interactive Statistics on Health (WISH) data query system
Wisconsin Dept. of Health Services, Division of Public Health, Alcohol Use in Wisconsin, revised October 2021
HOUSING AND HOMELESSNESS
Though not previously explored in NE Wisconsin status of women reports, homelessness available and affordable housing are significant indicators in the matrix of social determinants of health and well-being.
The Institute for Community Alliances (ICA) functions as the Homeless Management and Information System (HMIS) for Wisconsin and 13 other states, which is used to collect client- level data and data on the provision of housing and services to homeless individuals and families and persons at risk of homelessness on behalf of county homeless continua of care (CoC) agencies.
The ICA tracks homelessness populations by examining the Coordinated Entry (CE) process. CE identifies and assesses households in need of assistance by using the VI-SPDAT, a survey assessment the uses questions about an individual or family’s history of housing and homelessness. Responses to the VI-SPDAT assist in determining the order of a community’s Housing Priority List.
Learn more about the CE process here.
The ICA database tracks new and recurring households that are on the Housing Priority List. The ICA point in time database can stratify data on parameters including county, families with/without children, veteran status, chronic homelessness, unsheltered homelessness, and youth. Monthly dashboard parameters include county, gender, age, veteran status, race, and chronic homelessness. For more advanced demographics analysis, contact HMIS Manager Nancy Esteves (nancy.esteves@icalliances.org) to request a balance of state CE homeless summary to be run to include specific counties, households with/without children, race, ethnicity, gender, veteran status, and age. These reports will also show parameters like average length of time on list, total households returned to list, households fleeing domestic violence, and referral outcome.
POLITICAL REPRESENTATION
The Wisconsin Women’s Council recently published facts sheets on women in Wisconsin State Tribal Legislature, Judiciary, County Government, City Government, and Village Government in 2021. Access the updated facts sheets here.
VIOLENCE AGAINST WOMEN
From End Domestic Abuse WI’s website: “Since 2000, End Domestic Abuse Wisconsin (WCADV) has been researching, documenting and publishing an annual report detailing domestic violence-related homicides in Wisconsin. In doing so, our intent is to honor the victims and survivors of domestic violence homicide. We also want to support Wisconsin communities to create opportunities for intervention and prevention of homicide.”
The Human Trafficking Institute publishes yearly federal and state reports which provide “data on convictions, types of trafficking prosecuted, and trends over time so justice sector professionals, government agencies, and everyday advocates can analyze and improve the United States’ enforcement of trafficking laws.” Some data is stratified by district (Eastern and Western), but not by county.
From the Wisconsin Department of Justice website: “Under Wis. Stat. § 968.075 (9), district attorneys are required to annually report domestic abuse law enforcement responses, arrests, prosecutions, and convictions to the Wisconsin Department of Justice. In order to comply with this requirement, staff of the Wisconsin's District Attorney Information Technology (DA IT) Program extract data annually from PROTECT (PROsecutor TEchnology for Case Tracking)—a case management system used by district attorneys in Wisconsin—and provide it to the Bureau of Justice Information and Analysis (BJIA) at the Wisconsin Department of Justice. The data provided includes only those incidents reported to district attorneys’ offices by law enforcement, entered into, and flagged as a domestic case by staff within the district attorney's office. Law enforcement agencies and the district attorneys' offices are responsible for complete and accurate data reporting. The comprehensiveness and quality of the data presented are dependent upon thorough, accurate, and consistent entry of data at the county level.” Despite the fact that district attorneys are required to report domestic abuse data annually, the Department of Justice has not published data publicly since 2018.
Wisconsin Department of Justice, Division of Law Enforcement Services, Bureau of Justice Information and Analysis,Domestic Abuse Data
WOMEN IN POVERTY
In this section, updated poverty guidelines as well as U.S. Census Bureau CPS and ACS tables on poverty status by state, poverty status by household type by number of children, and poverty status by household type by age are included.
Office of the Assistant Secretary for Planning and Evaluation, Poverty Guidelines
U.S. Census Bureau, Current Population Survey (CPS), POV-46. Poverty Status by State
U.S. Census Bureau, American Community Survey, B17012 Poverty Status in the Past 12 Months of Families by Household Type by Number of Related Children Under 18 Years, 1-year and 5-year estimates
U.S. Census Bureau, American Community Survey, B17017, Poverty Status in the Past 12 Months by Household Type by Age of Householder, 1-year and5-year estimates
Additionally, find information on poverty among the population aged 65+ from the Congressional Research Service and the importance of social security for women from the Social Security Administration. Also included are reports on facts about women in poverty from the Center for American Progress (CAP) and an analysis of living wage in Wisconsin by the Institute for Women’s Policy Research (IWPR). Keep in mind that though the CAP analyzes reliable data from the U.S. Census Bureau CPS, it is generally considered to be liberally biased. Although the IWPR report is specific to Wisconsin, the others reports are based on national data.
WOMEN IN THE POPULATION
The following U.S. Census Bureau ACS tables and WISH Population Module encapsulate population count data of women by age, race, ethnicity, and geography.
U.S. Census Bureau, American Community Survey, B01001 Sex by Age, 1-year and 5-yearestimates. (All Women)
U.S. Census Bureau, American Community Survey, B01001B / C / D / H / I Sex by Age, 1-year and 5-yearestimates. (Racial/Ethnic data)
U.S. Census Bureau, American Community Survey, B01002 Median Age by Sex, 1-year and 5-year estimates. (All Women)
U.S. Census Bureau, American Community Survey, B01002B / C / D / H / I Median Age by Sex, 1-year and 5-yearestimates. (Racial/Ethnic data)
Wisconsin Dept. of Health Services, Division of Public Health, Office of Health Informatics, Wisconsin Interactive Statistics on Health (WISH) data query system
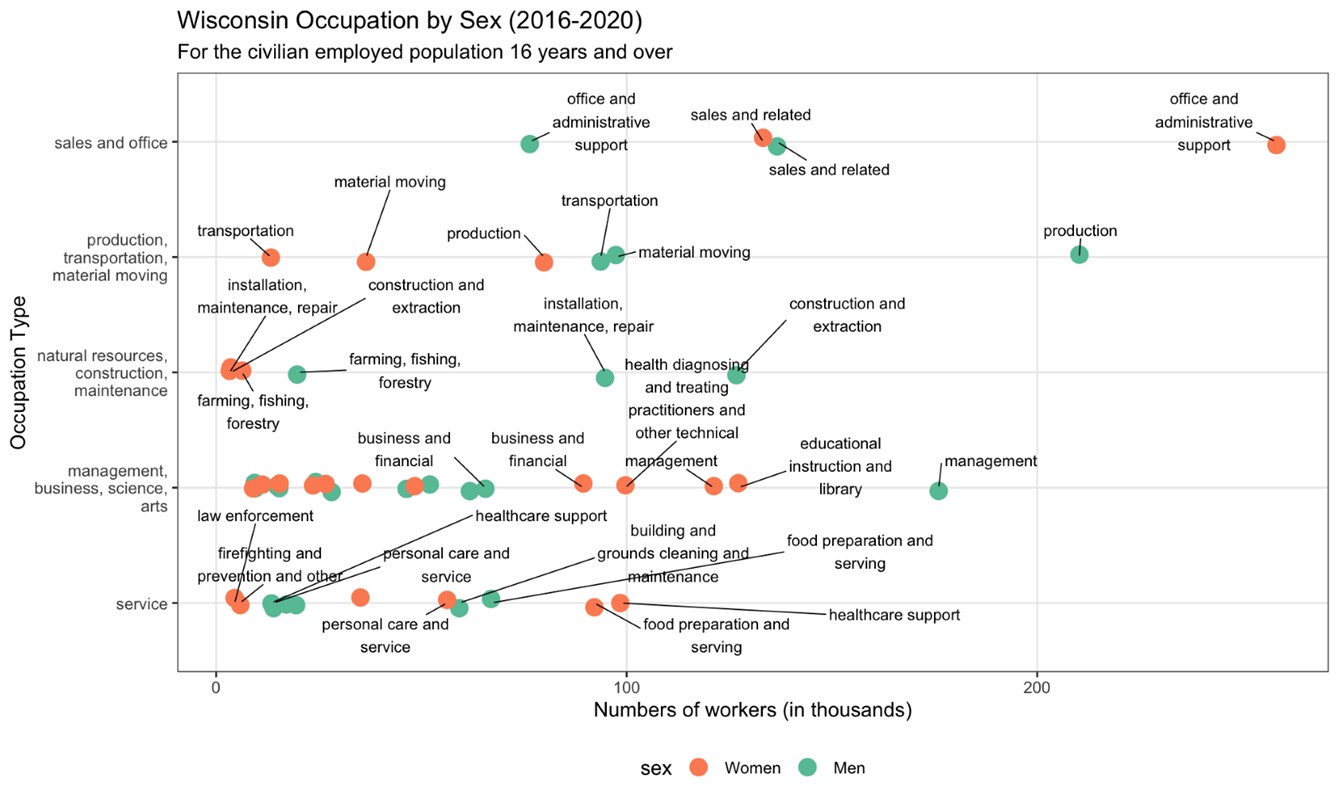
WOMEN, WORK, AND WAGES
The following U.S. Census Bureau tables summarize work and wage data by sex and by occupation for the full-time, year-round civilian employed population age 16 and over and for the general civilian employed population age 16 and over. The third table summarizes median earnings by sex and occupation for the full-time, year-round civilian employed population age 16 and over.
U.S. Census Bureau, American Community Survey, C24020 Sex by Occupations for the Full-time, Year-round Civilian Employed Population Age 16 and Over,1-year and 5-yearestimates.
U.S. Census Bureau, American Community Survey, S2401 Occupations by Sex for the Civilian Employed Population Age 16 and Over,1-year and 5-year estimates.
U.S. Census Bureau, American Community Survey, S2411 Occupations by Sex and Median Earnings in the Past 12 Months (in 2020/2019 inflation-adjusted dollars) for the Full-time, Year-round Civilian Employed Population Age 16 and Over, 1-year and 5-year estimates.
The IWPR often releases reports and analyses reframing how we think about the wage gap. This report examines factors other than median weekly earnings for full-time employees including race and occupational segregation.
Finally, the Bureau of Labor Statistics provides detailed data tables about the national labor force. There is also state-stratified data available for annual average median weekly earnings.
WOMEN'S BUSINESS OWNERSHIP
The U.S. Census Bureau Annual Business Survey (ABS) collects data on characteristics—sex, ethnicity, race, immigration status, etc.—for both businesses and business owners.
U.S. Census Bureau, Annual Business Survey (ABS), 2020 ABS Company Summary, AB1900CSA01 Statistics for Employer Firms by Industry, Sex, Ethnicity, Race, and Veteran Status for the U.S., States, and Metro Areas.
Note: The Annual Business Survey uses the collection year in the survey name rather than a single reference year. For instance, the 2020 ABS covers the reference year 2019.
The COVID PANDEMIC
STATUS OF WOMEN DURING COVID-19
DATA DISRUPTION DURING COVID-19